Time that land forgot
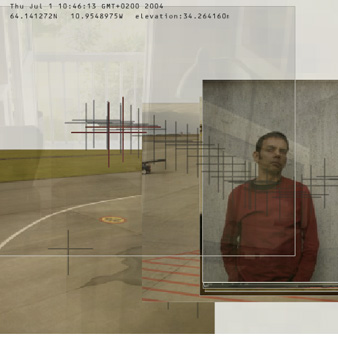
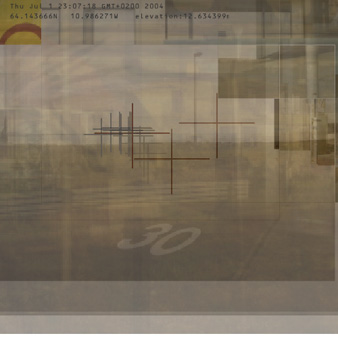
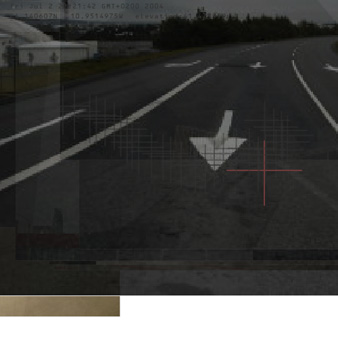
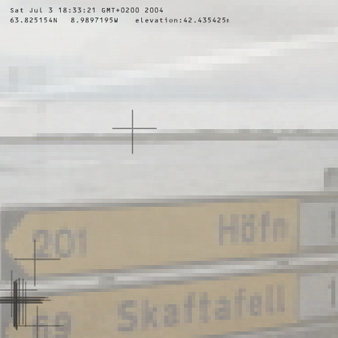
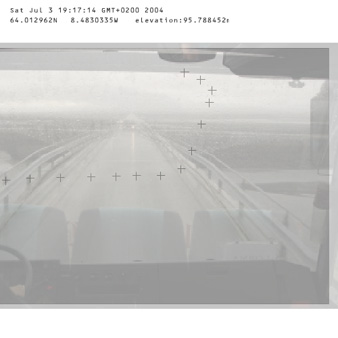
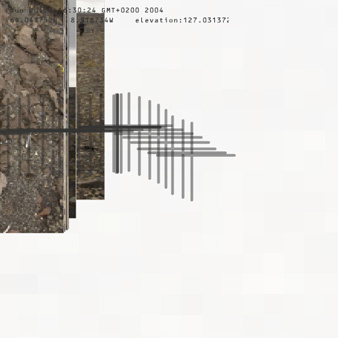
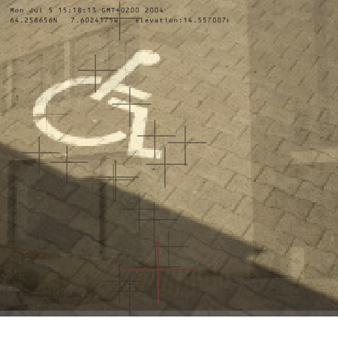
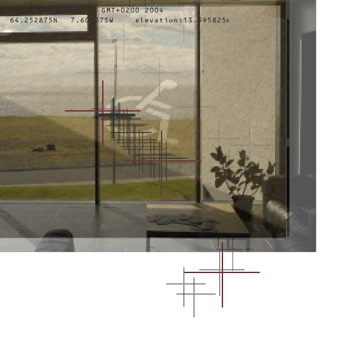
A ‘camera’ rides along a GPS track, centring itself on the advancing ‘now’ while keeping the last 20-30 minutes of route in view. Photographs taken along the way surface as the track passes their location, then fade as new ones arrive. Red ticks mark hours, black ticks mark minutes. The view scales itself automatically to the speed of travel, walking, bus, plane.
A project with Even Westvang, made in ten days in July 2004 at the Iceland inside-and-out workshop in Hofn, as part of the Trans-cultural Mapping workshop series. High-bandwidth prototype with images. Low-bandwidth no-image version. Quicktime movie for those who can’t run Flash at a reasonable frame rate. Source code released under GPL.
Background: narrative images and GPS tracks
For the last five years I have been photographing daily experience with a digital camera and archiving thousands of images by date and time. Transient, ephemeral, numerous, these images have become a sequential narrative beyond the photographic frame. They sit somewhere between photography and film, with less emphasis on the single image in representing experience.
For the duration of the Iceland workshop I used a GPS receiver to record tracklogs, capturing geographic coordinates for every part of the journey. It is this data we explore here, using it to give history and context to the images.
The project is particularly relevant as mobile phones start to integrate location-aware technology and as cameraphone image-making becomes commonplace.
Scenarios
Who would use this, and what for? In our case I was using the photographs as a personal diary, and this is the first scenario: a personal life-log where visualisations help recollect events, periods, patterns.
Then there is the close network of friends and family, or participants in the same journey, who are likely to invest time looking at the system and finding their own perspective in it. Beyond that, a wider audience interested in images and information about places, a richer understanding of places they have never been, or places they’ve experienced from a different perspective.
Images are immediately useful and communicative for all these audiences. It’s less clear how the geographic information should be used: the GPS tracks might only be interesting to people who participated in that particular journey or event.
Research
We looked at existing photo-mapping work and found a lot of projects that attempted to give images context by placing them within a map. These visualisations foreground the map over the images, photos embedded in maps get lost by layering. The problem was most dramatic with topographic or street maps full of superfluous detail, detracting from the immediate experience of the image.
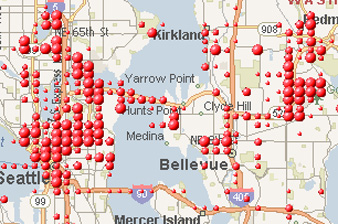
Even Microsoft’s exhaustive World Wide Media Index (WWMX) research arrives at a somewhat unsatisfactory visual interface. Their paper details five mapping alternatives and settles on a solution that averages the number of photos in any particular area, giving it a representatively scaled ‘blob’ on a street map. It works for massive datasets but as an interface it’s clunky and overlooks the image itself.
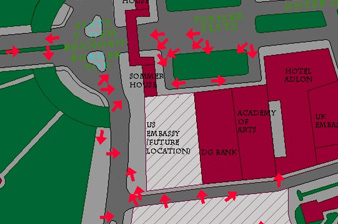
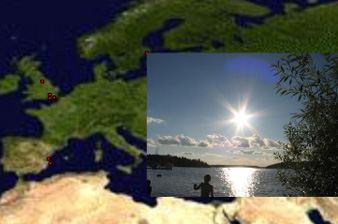
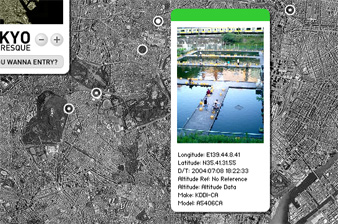
Other examples handle the problem differently. Geophotoblog pins images to locations but staggers them in time to avoid layering. An architectural map of Pariser Platz in Berlin gives an indication of direction. Tokyo Picturesque uses an aerial photo as context for user-submitted photos. There are more examples of prior work, papers and technologies in my companion post.
By shifting the emphasis to location, what’s most clearly lacking in these representations is time, and therefore the context in which images most easily form narrative for the viewer. These images are subordinate to the map, which removes the instant expressivity of the image.
These orderings make spatially annotated images a weaker proposition than simple sequential images for telling the photographer’s story. This is the problem of seemingly objective space (the GPS coordinates) versus the subjective place of actual experience.
Using GPS data
The GPS tracks contain:
- location
- heading
- speed in three dimensions
- elevation
- time of day
- time of year
With a little processing and a little extra data, we can derive:
- acceleration in three dimensions
- change in heading
- mode of transportation (roughly)
- nearest landmark or town
- actual recorded temperature and weather
- many other possibilities from local or syndicated data
Would it be useful to navigate photographs by acceleration, selecting arrivals and departures by picking images taken at moments of greatest acceleration or deceleration? Would those be the equivalent of ‘establishing’, ‘resolution’ or ‘transition’ shots in film, generating a good narrative frame for a story?
Would looking at photos by time of day give a good indication of patterns and habits? The superimposition of daily trails of an habitual office dweller might show interesting departures from rote behaviour.
Using photo data
Analysing image metadata gives another axis. Almost all digital images are saved with date and time of capture, but there are also unexplored EXIF tags:
- exposure
- aperture
- focus distance
- focal length
- white balance
We analysed metadata from almost 7000 photographs taken between 18 February and 26 July 2004 to see what patterns might be exploitable for new interfaces. We specifically looked for changes over the course of the day.
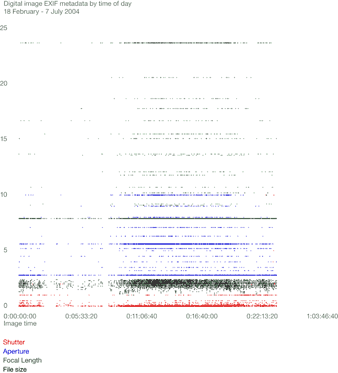
This shows an increase in shutter speed and aperture during the middle of the day. The images also become sharper during daylight hours, indicated by an increased file size.
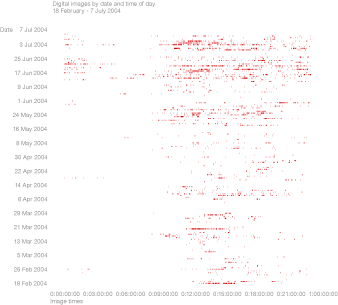
This shows definite patterns: holidays and travels are clearly visible (three horizontal clusters towards the top), as are late-night parties and early-morning flights. Lightweight metadata like this is enough to drive navigation across a large archive. Image-based life-log applications like Flickr and Lifeblog are appearing, and visualisation of this lightweight metadata will be invaluable for re-presenting and navigating large photographic archives.
Matias Arje, also at the Iceland workshop, has done valuable work in this direction.
Technicalities
Getting at the GPS and EXIF data was fairly trivial, though it demanded some testing and swearing.
We are both on Apple OS X, and we had to borrow a PC to get the tracklogs reliably out of my GPS and into Garmin’s Mapsource. We chose GPX as the format for the GPS tracks; GPSBabel happily created this from the original Garmin files.
The EXIF was parsed out of the images by a few lines of Python using the EXIF.py module and turned into another XML file with image filename and timestamp.
We chose Flash as the container for the front end, it is ubiquitous, and Even’s programming poison of choice for visualisation. Flash reads both the GPX and EXIF XML files and generates the display in real-time.
More on our choices of technologies in the companion post.
First prototype
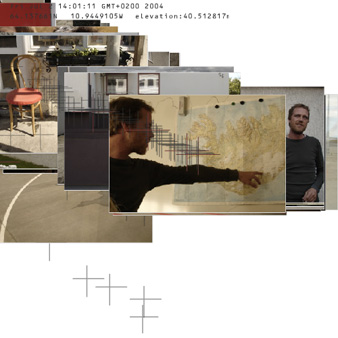
Even has invested serious time and thought in dynamic continuous interfaces. The first prototype is a linear experience of a journey, suitable for a gallery or screening, where images overlay into textural clusters of experience. The display shows a scaling representation of the travel route based on distance covered in the last 20–30 minutes. Images recede in scale and importance as they move back in time. Each tick represents one minute; every red tick represents an hour.
We chose to balance the interface around a set of priorities: image first (for expressivity), then time (for narrative), then location (for spatialising, and commenting on, image and time).
There is a problem of scale. The GPS data has a resolution down to a few metres, but the range of speeds a person can travel at varies wildly across different modes of transport. The interface had to take the temporo-spatial scope of the data into account and scale the resolution of display accordingly.
This was solved by creating a ‘camera’ connected to a spring system that attempts to centre the image on the advancing ‘now’ while keeping a recent history of 20 points in view. The parser for the GPS tracks discards positional data between the minutes. Animation is driven forward by every new ‘minute’ found in the track, inserted into the camera’s view. This animation system can be used both for generating animations and for interactive views of the dataset.
There are some issues. Discontinuities appear in the tracklogs when the GPS is switched off during standstills and nights. Currently the system smooths tracklog time to make breaks seem more like quick transitions.
Ideally the system would maintain a ‘subjective feeling’ of time adjusted to picture-taking and movement, a temporal scaling as well as a spatial one. This would be analogous to remembering events: minute memories from double-loop roller-coasters, smudged holes of memory from sleepy nights.
Most of the tweaking in the animation system went into refining the extents system around camera history and zoom, the acceleration and friction of spring systems, and the ratio between insertion of new points and animation ticks.
For processing speed this interface should ideally have been built in Java or as a standalone application, but tests show that Flash can parse a 6000-point tracklog and draw it on screen alongside 400 medium-resolution images. Once the images and points have been drawn on the canvas they animate at reasonable speed on mid-spec hardware.
Conclusions
This prototype has shown that many technical challenges are solvable, and given us a working space to develop more visualisations and interactive environments, using this as a tool for thinking about wider design issues in geo-referenced photography. The visualisation gives a sense of ‘groundedness’ over the images, and spatial relationships develop between them.
For me it has given a new sense of spatiality to image-making. The images are no longer locked into a simple sequential narrative but are affected by spatial differences like location and speed. I’m now experimenting with more ambient recording, taking a photo exactly every 20 minutes, for instance, to affect the presentation.
Extensions
Another strand we explored was the metaphor of a 16mm Steenbeck edit deck: scrubbing 16mm film through the playhead and watching the resulting sound and image come together. We could use the scrubbing of an image timeline to control all the other metadata, giving real control to the user. It would be exciting to explore a spatial timeline of images correlated with contextual data like GPS tracks.

We need to overcome the difficulty of obtaining quality data, especially if we expect this to work in an urban environment. GPS is not passive; it requires a lot of attention to record tracks. Our representation doesn’t require location accuracy, just consistency and ubiquity, we hope something like cell-based tracking on a mobile phone becomes more ubiquitous and usable.
We would like to experiment further with the extracted image metadata. For large-scale overviews, images could be replaced by a simple rectangular proxy, coloured by the average hue of the original picture and taking brightness (EV) from exposure and aperture readings. This would show the actual brightness recorded by the camera’s light meter rather than the brightness of the image.
Imagine a series of images from bright green vacation days, dark grey winter mornings, or blue Icelandic glaciers, combined with the clusters and patterns that time-based visualisation offers.
We would also like to extend the datasets to include other people, from teenagers using GPS camera phones in Japan to photojournalists. How would visualisations differ, and are there variables we can pre-set for different uses? And how would the map look with multiple trails to follow, as a collaboration between multiple people and multiple perspectives?
At a technical level it would be good to have more integration with developing standards. We’d like to use Locative packets; we just need more time and reference material. This would make the system useful as a visualisation tool for other projects, Aware for example.
We hope the system will be used to present work from other workshops, and that an interactive installation of the piece can be set up at Art + Communication.
Biographies
Even Westvang works between interaction design, research and artistic practice. Recent work includes a slowly growing digital organism that roams the LAN of a Norwegian secondary school, and an interactive installation for the University of Oslo on immersion, interaction and narrative. Even lives and works in Oslo. His musings live at polarfront.org and some of his work can be seen at bengler.no.
Timo Arnall is an interaction designer and researcher working in London, Oslo and Helsinki. Recent design projects include a social networking application, an MMS-based interactive television show, and a large media archiving project. Current research directions explore mapping, photography and marking in public places. Work and research at elasticspace.com.
Screenshots